Things that might disappear by 2050

Top Possible Extinctions by 2050

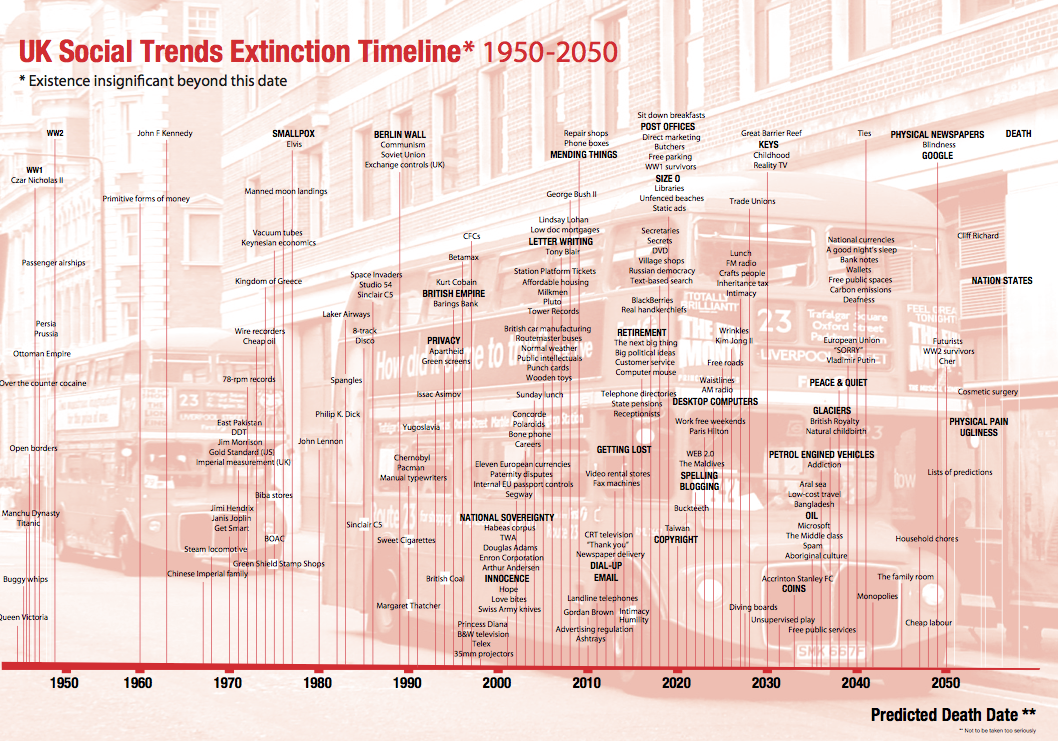
Some of you might remember the extinction timeline I designed with Ross Dawson a few years ago and perhaps even the update, which for some strange reason I did as an oil painting (it seemed like a really good idea at the time).

Anyway, here’s a further update featuring the possible extinction of privacy, handwriting, physical credit cards, video game consoles, the great barrier reef, malaria, commercial ocean fishing, surgeons, car accidents and perhaps even death by 2050. Thanks for Zeljko Zoricic for the visualisation.

Screen shot 2014-05-23 at 11.11.41

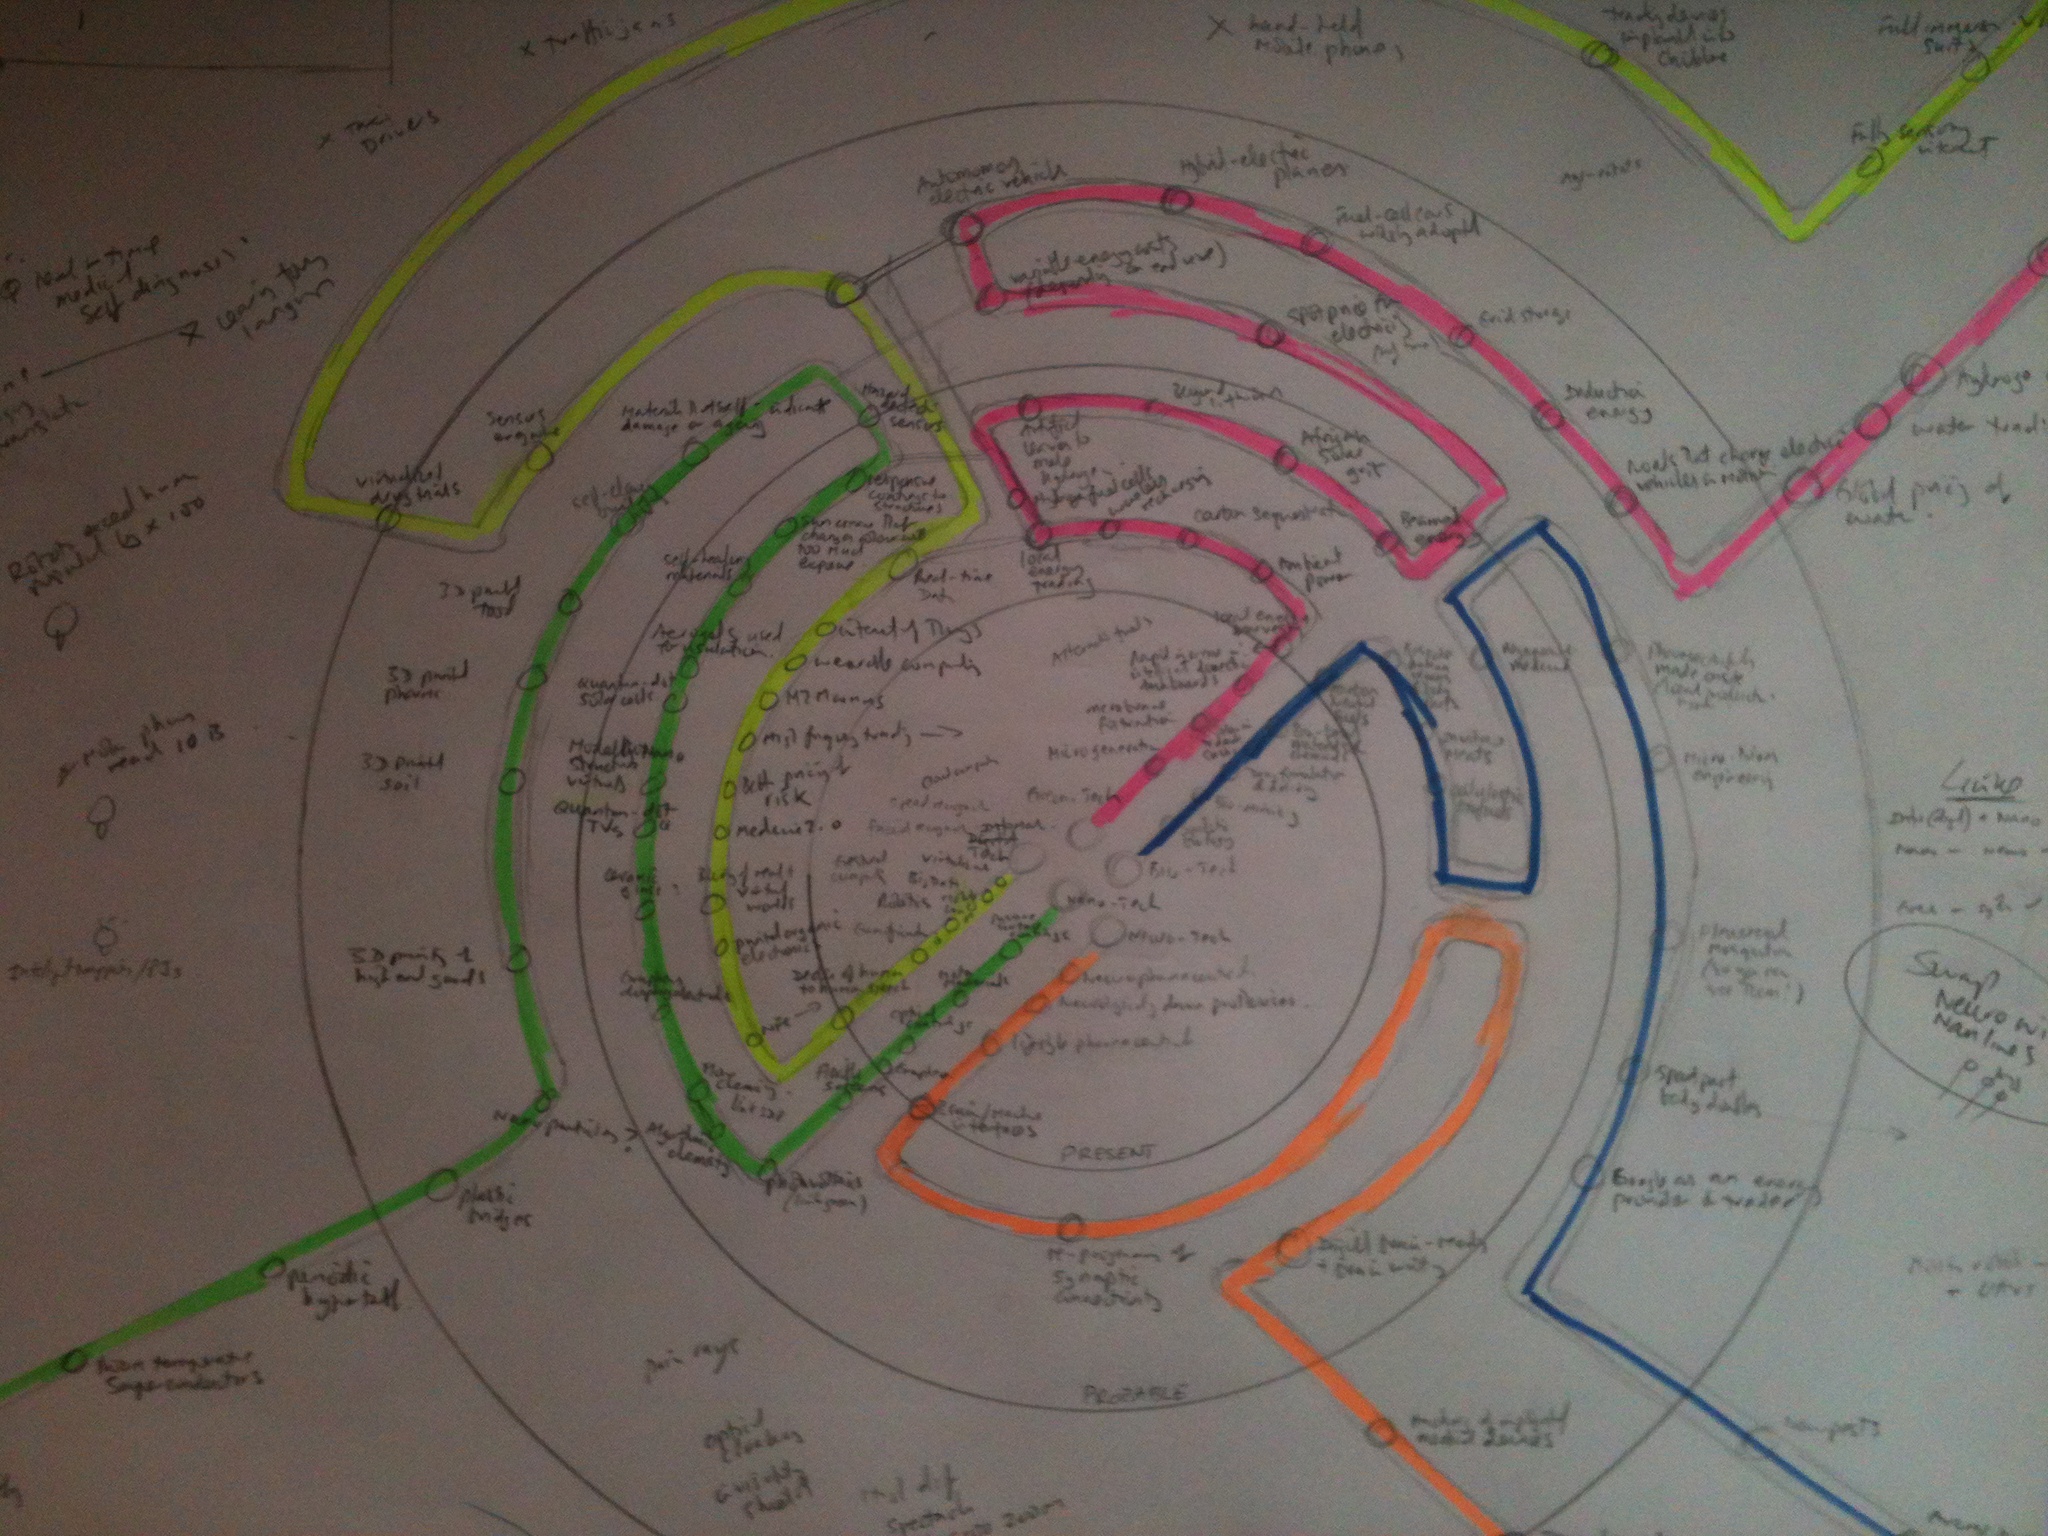
Map of emerging science & technology

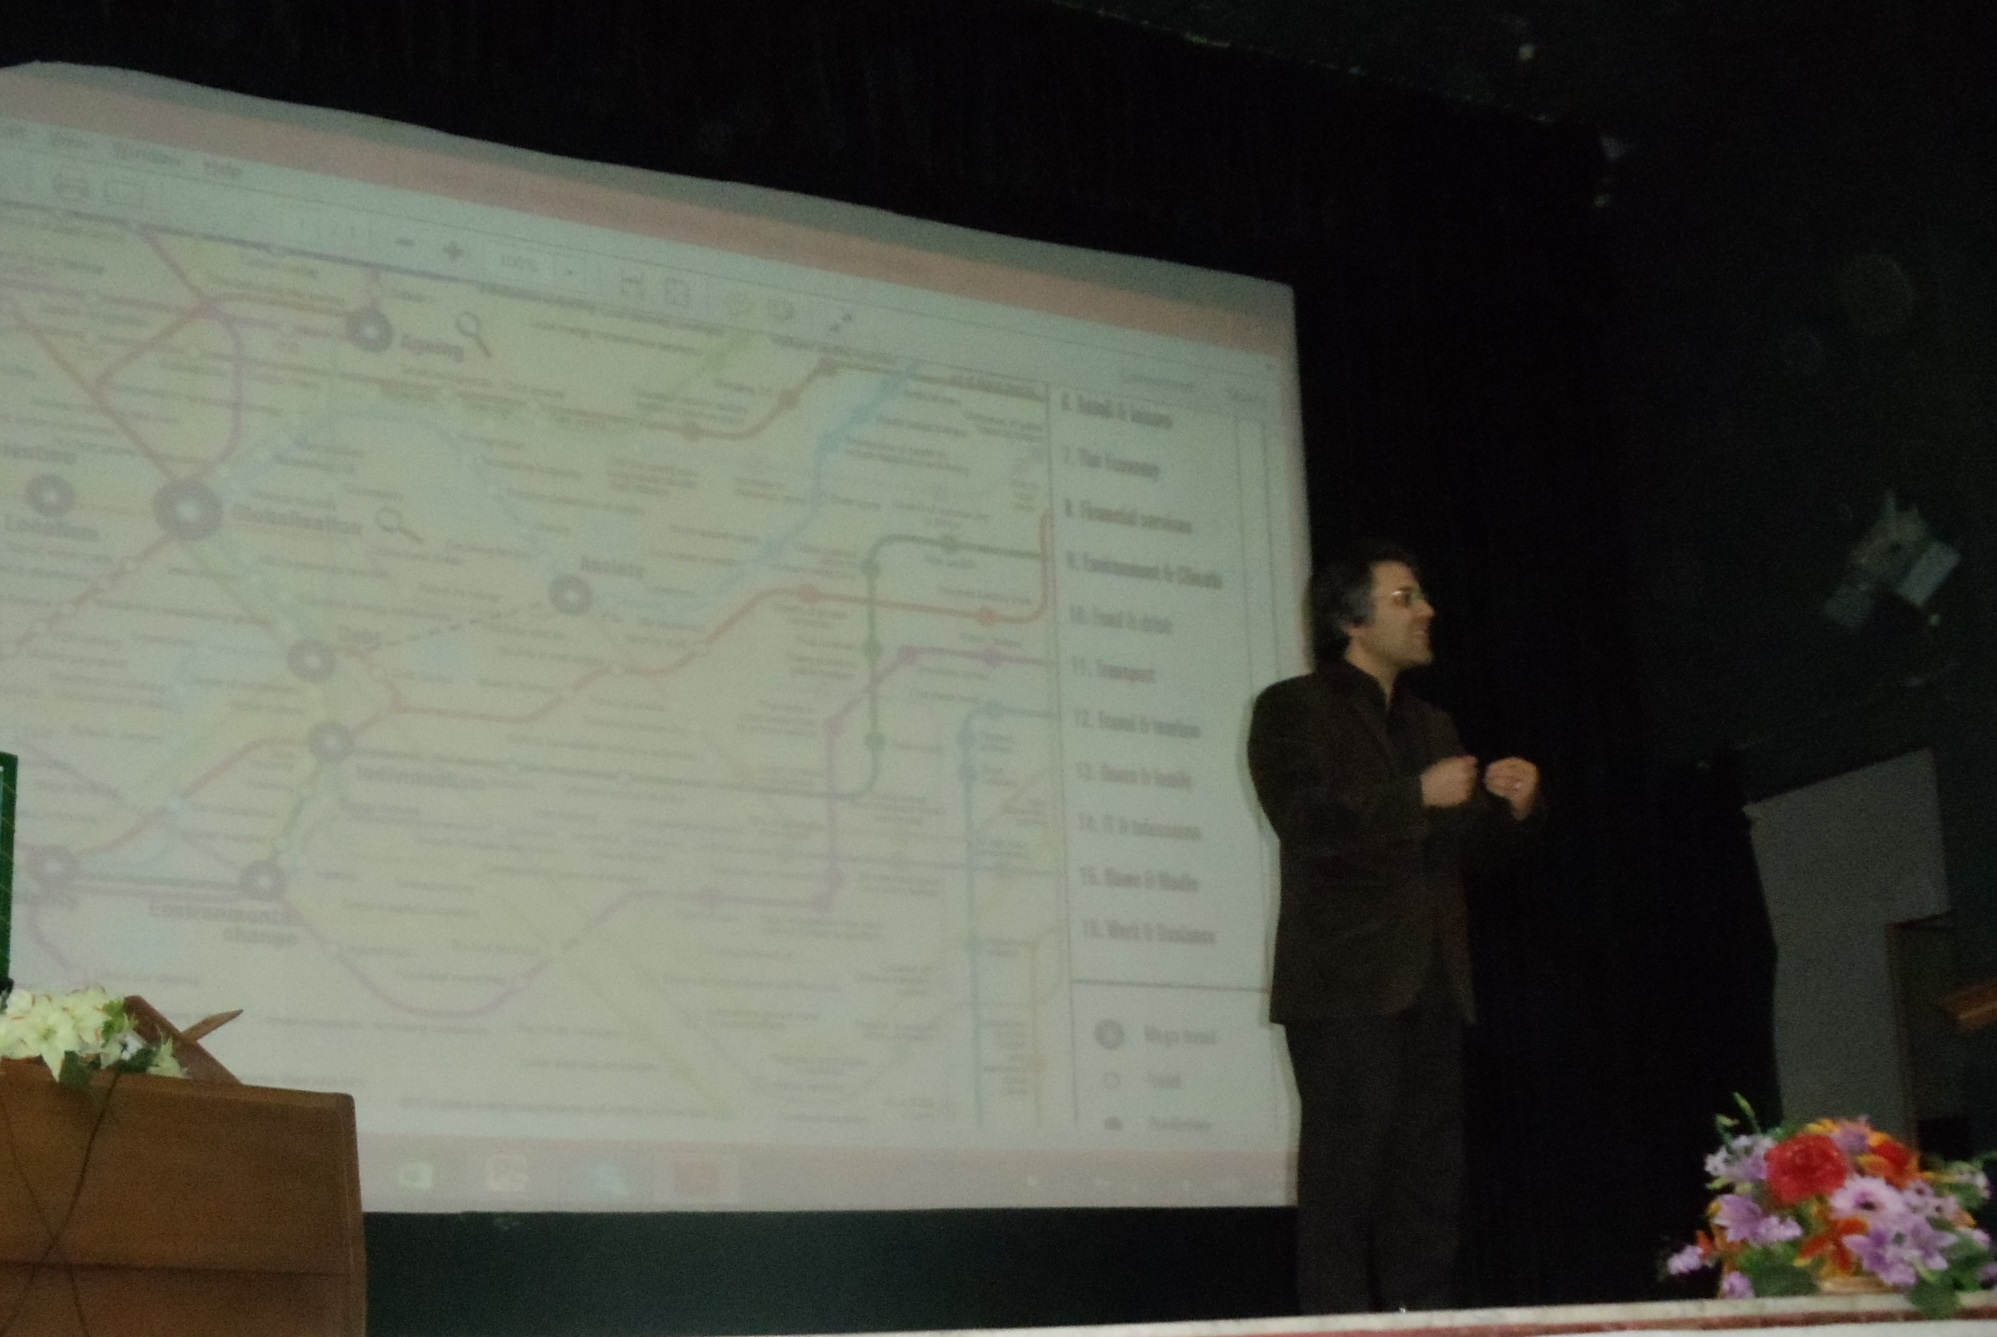
Iran

Seems my trends & technology timeline from 2010 has made it to Iran (above).

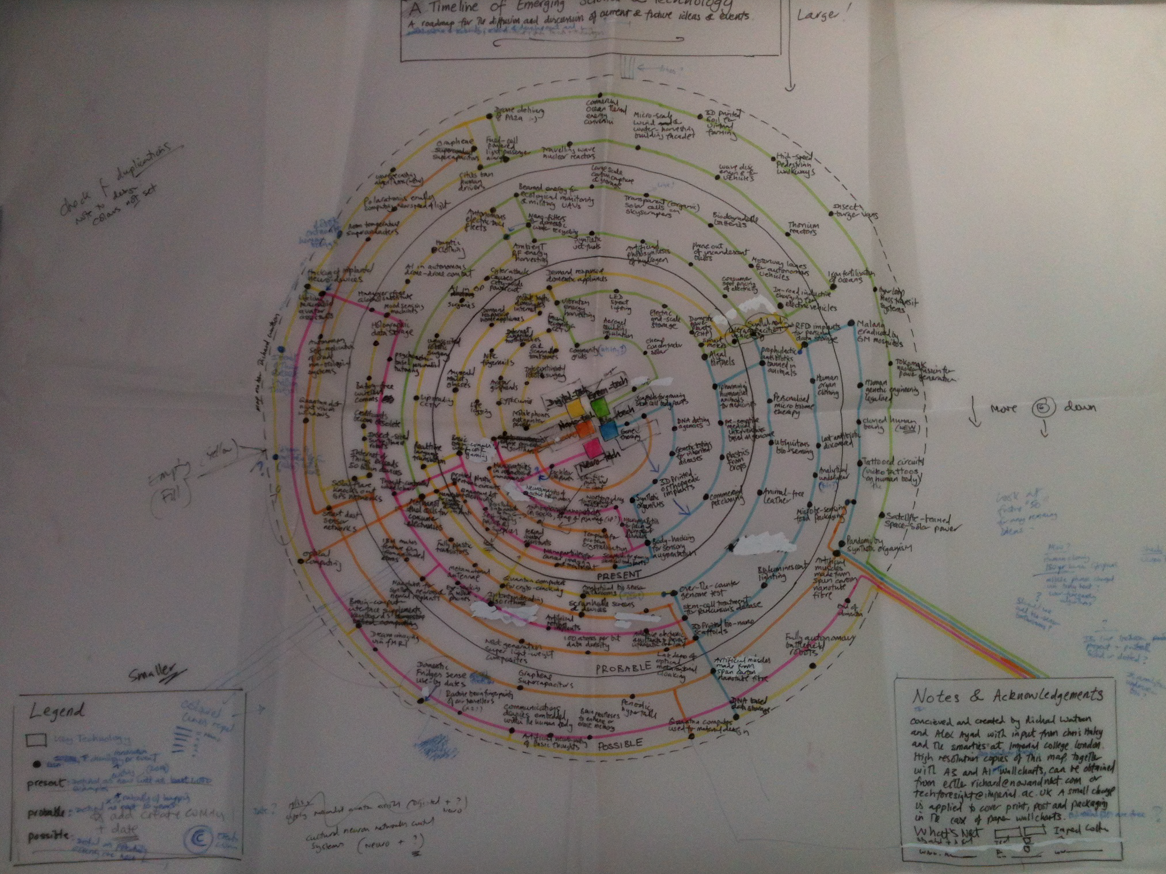
BTW, my new emerging technologies timeline that I’m doing with Imperial College is done (below) and now just needs some design polish. It has been thought about very carefully indeed, especially by about a dozen PhDs, and should be huge. Far better than anything similar I’ve ever seen. Hopefully available as a free high resolution download in a week or two and good old fashioned A1 and A3 paper wall charts a bit after that.

Screen shot 2014-05-16 at 10.43.52


IMG_2197

Screens Vs Paper (and comprehension)

IMG_1636


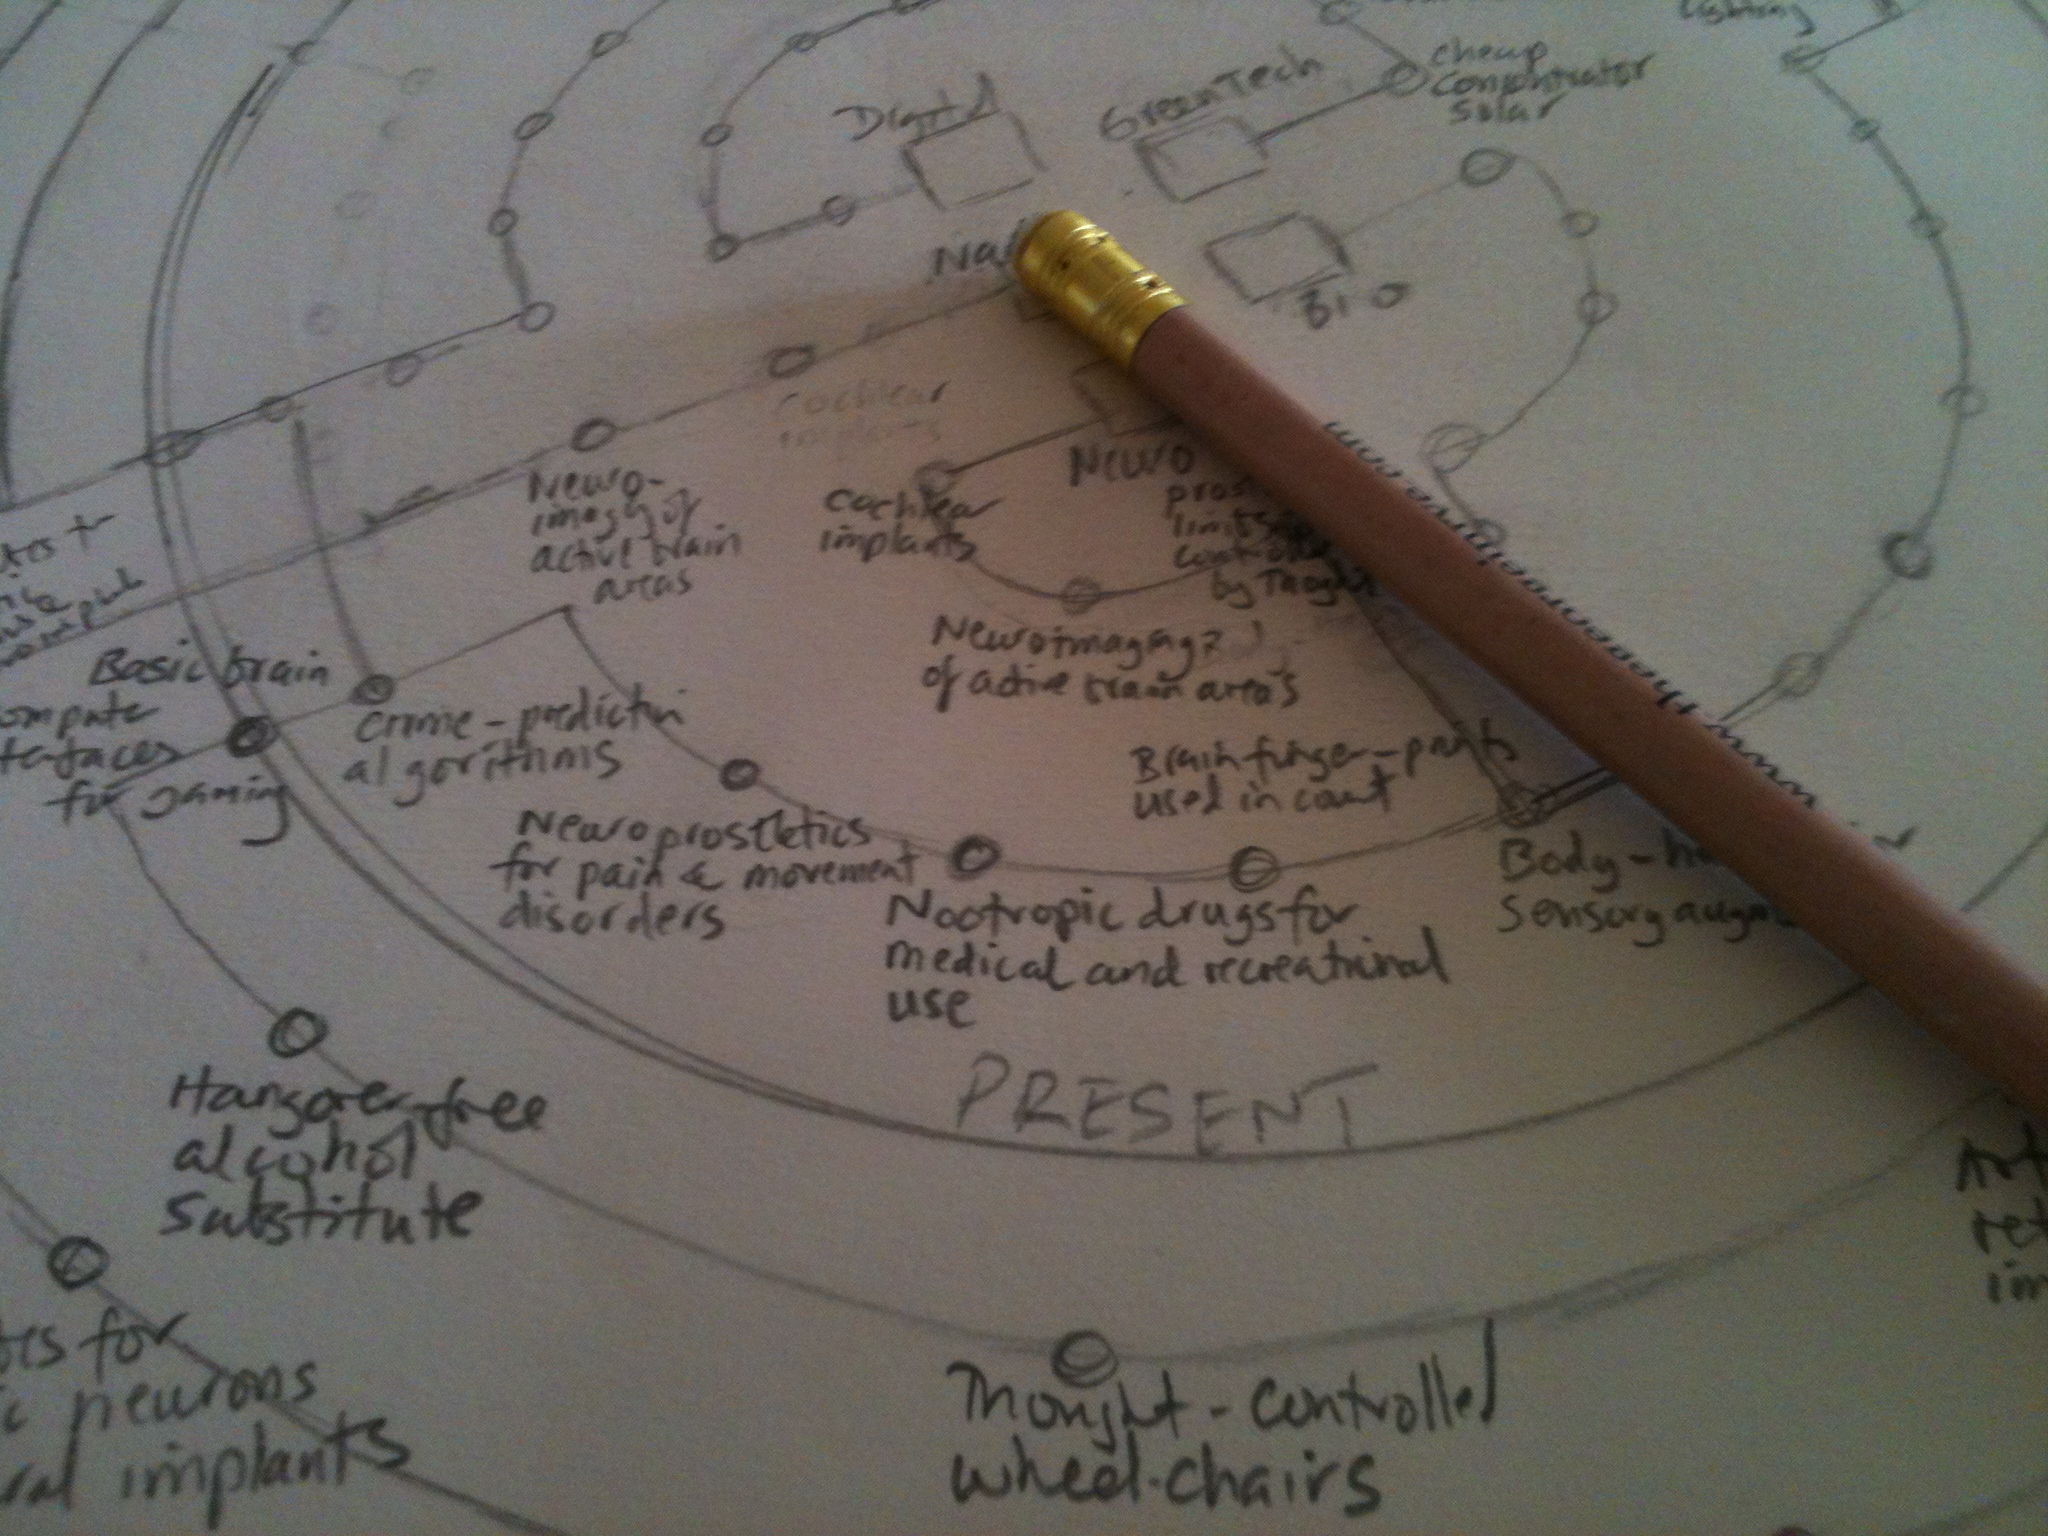
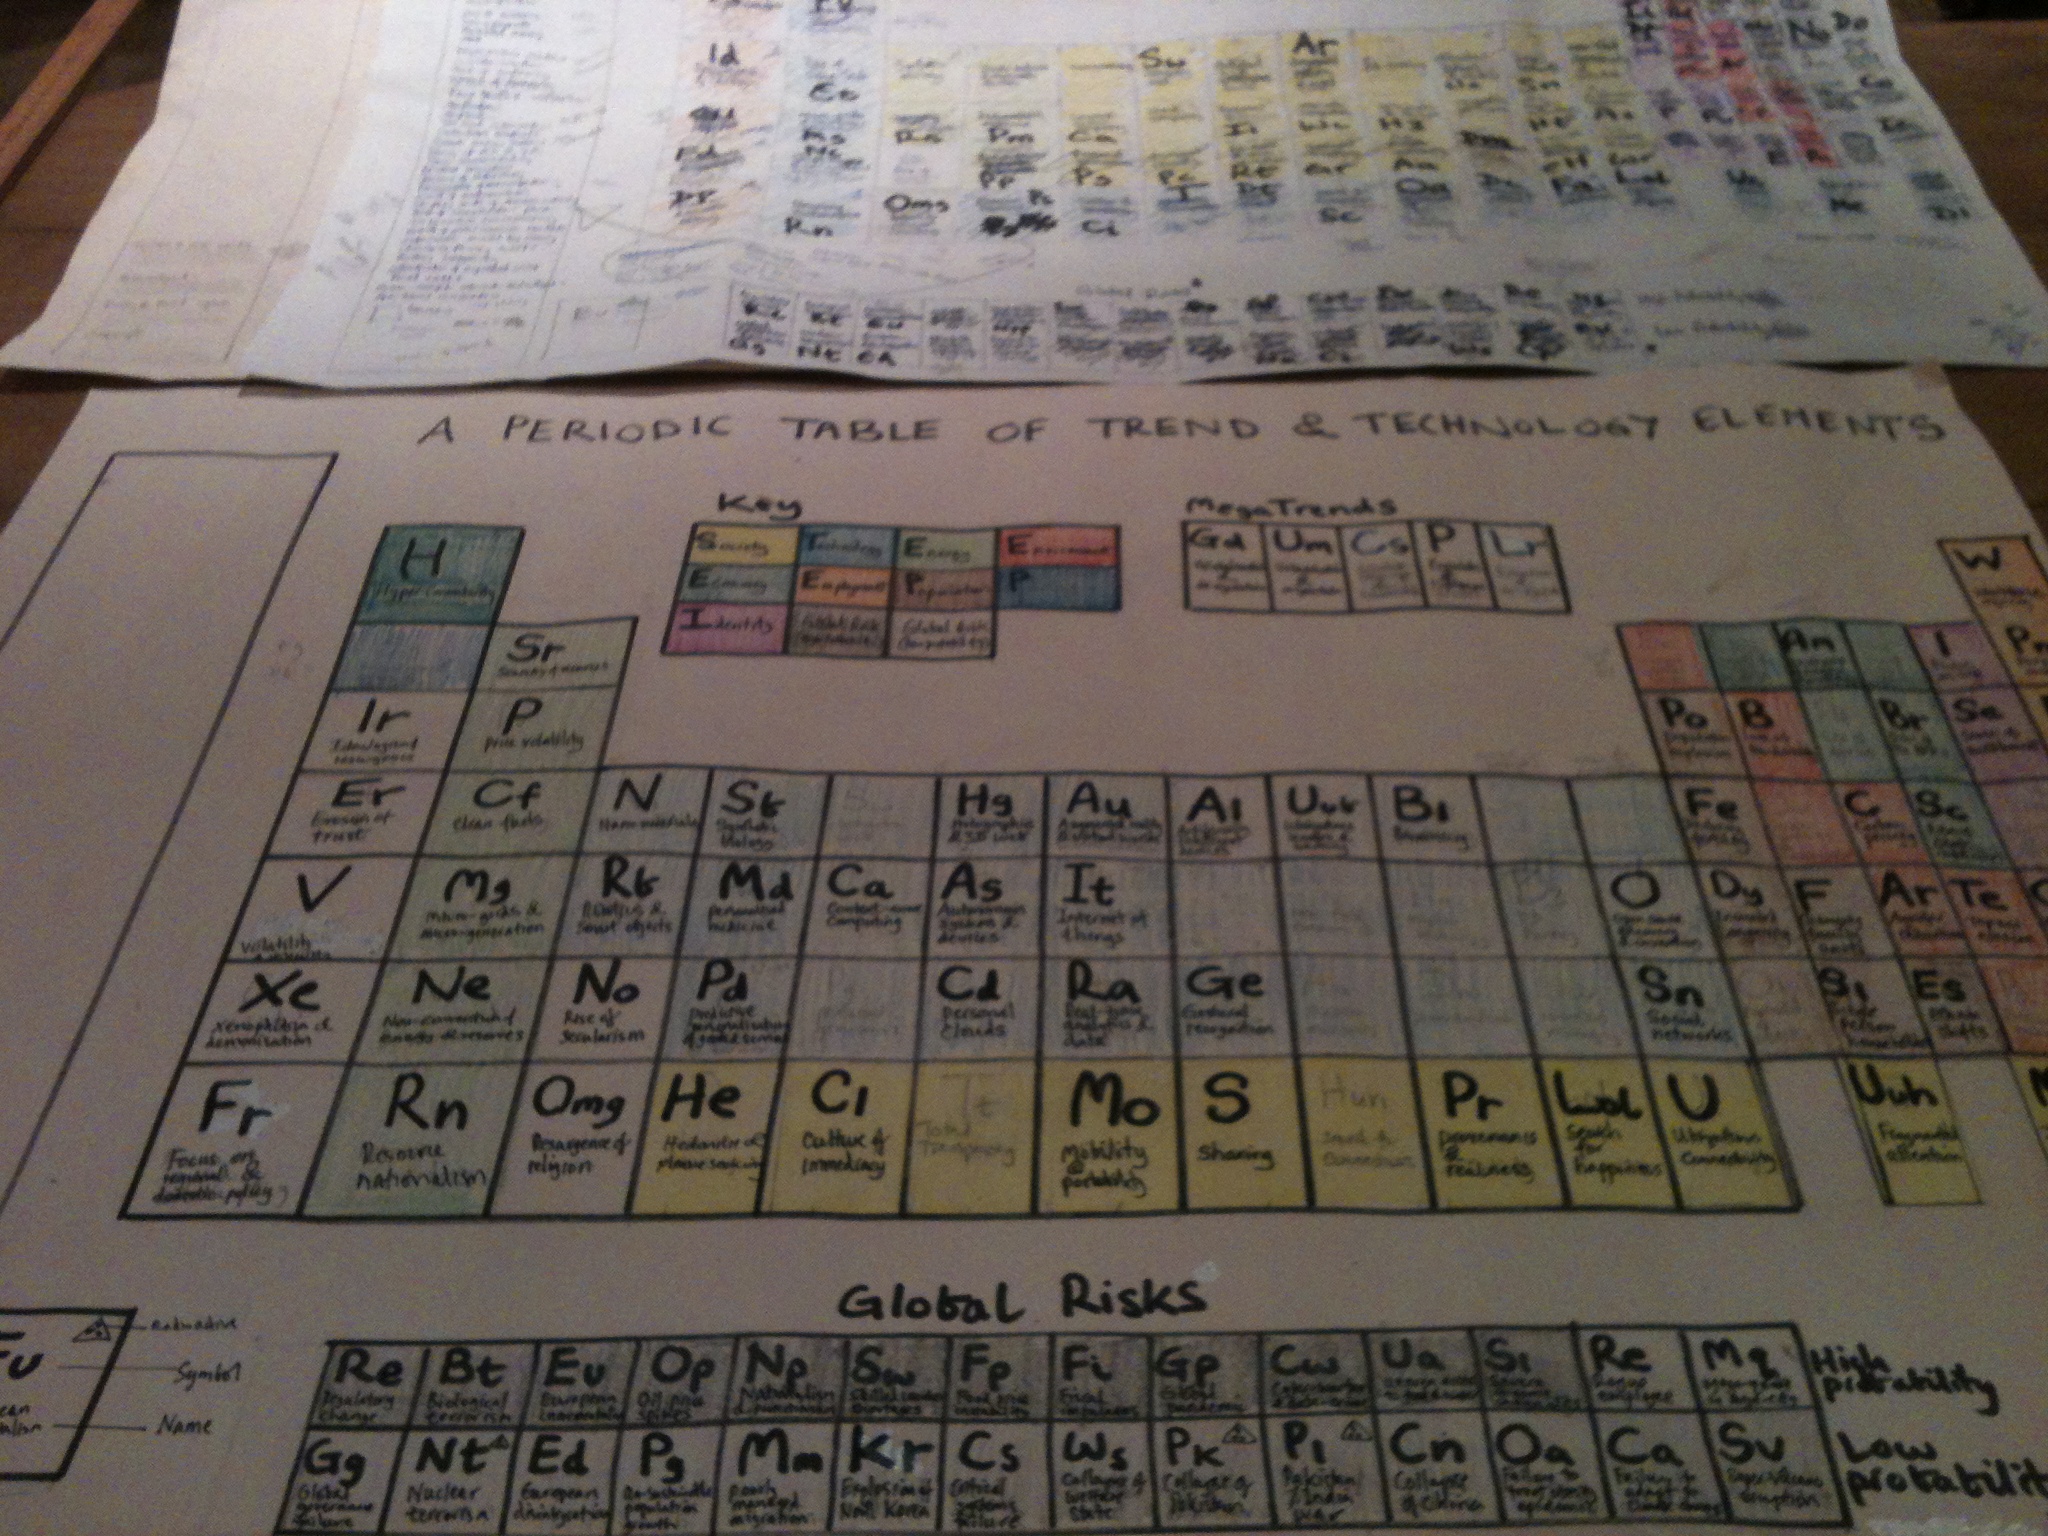
I’ve just (almost) completed some scenarios for the future of gaming so I’m back in the office scribbling like a demon. The latest scribble is a map of emerging technologies and it occurs to me that I am never happier than when I’ve got a sharp pencil in my hand and a large sheet of white paper stretching out in front of me.

Thinking of this, there was an excellent piece this time last year (22/29 December 2012) in the New Scientist on the power of doodles. Freud, apparently, thought that doodles were a back door into the psyche (of course he did – a carrot was never a carrot, right). Meanwhile, a study by Capital University suggests that the complexity of a doodle is not correlated in any way with how distracted a person is. Indeed, doodling can support concentration and improve memory and understanding. Phew.

While I’m on the subject of paper by the way, there’s an excellent paper on why the brain prefers paper in Scientific American (issue of November 2013). Here are a few choice quotes:

“Whether they realise it or not, people often approach computers and tablets with a state of mind less conductive to learning than the one they bring to paper.”

“In recent research by Karin James of Indiana University Bloomington, the reading circuits of five-year-old children crackled with activity when they practiced writing letters by hand, but not when they typed letters on a keyboard.”

“Screens sometimes impair comprehension precisely because they distort peoples’ sense of place in a text.”

“Students who had read study material on a screen relied much more on remembering than knowing.”

Resources for scenario planning and futures thinking

The problem, of course, with saying that you are not blogging for a while (previous post) is that when you start blogging again it could reasonably be expected that you will say something hugely important. Well sorry to disappoint, but I’m still working on that. In the meantime I have noticed a few things of relevance to anyone involved with thinking about the distant future, which I thought I’d share.

The first is a paper by Jessica Bland and Stian Westlake at NESTA (a UK organisation providing grants and research for innovation and early stage ideas). It’s called Don’t Stop Thinking About Tomorrow: A Modest Defence of Futurology. Click here for the PDF (24 pages). Thanks to Alex Ayad at Imperial College London for sending this.

Broadly, what it says is that new forms of data potentially provide a variety of new ways to forecast the immediate future. This, I guess, taps into the thoughts of Nate Silver and the area of ‘Big Data’. The paper also suggests that scenarios – done well I should add – can help organisations to become more resilient in the face of extreme change. Third, it suggests that narratives around how the future could look are essential ingredients in the innovation process. This last point is a good one because in my experience scenarios are generally thought of as a corporate strategy tool when in fact they can also be hugely useful for innovation, category management and risk also.

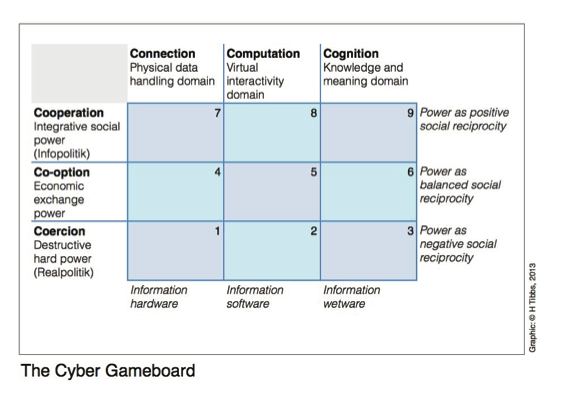
The other item of interest is a UK Defence Academy document about cyber-crime, although the real ‘find’ is a three by three matrix that Hardin Tibbs at Synthesys Strategic Consulting has developed. As Hardin explains it: “The ‘Cyber Gameboard’ consists of a nine-cell grid. The horizontal direction on the grid is divided into three columns representing aspects of information (i.e. cyber): connection, computation and cognition. The vertical direction on the grid is divided into three rows representing types of power: coercion, co-option, and cooperation. The nine cells of the grid represent all the possible combinations of power and information – in other words, cyberpower. The grid then allows interactions between cyber players to be mapped.” (Thanks to Oliver Freeman at Futures House in Sydney for sending this).


Get the whole report here.

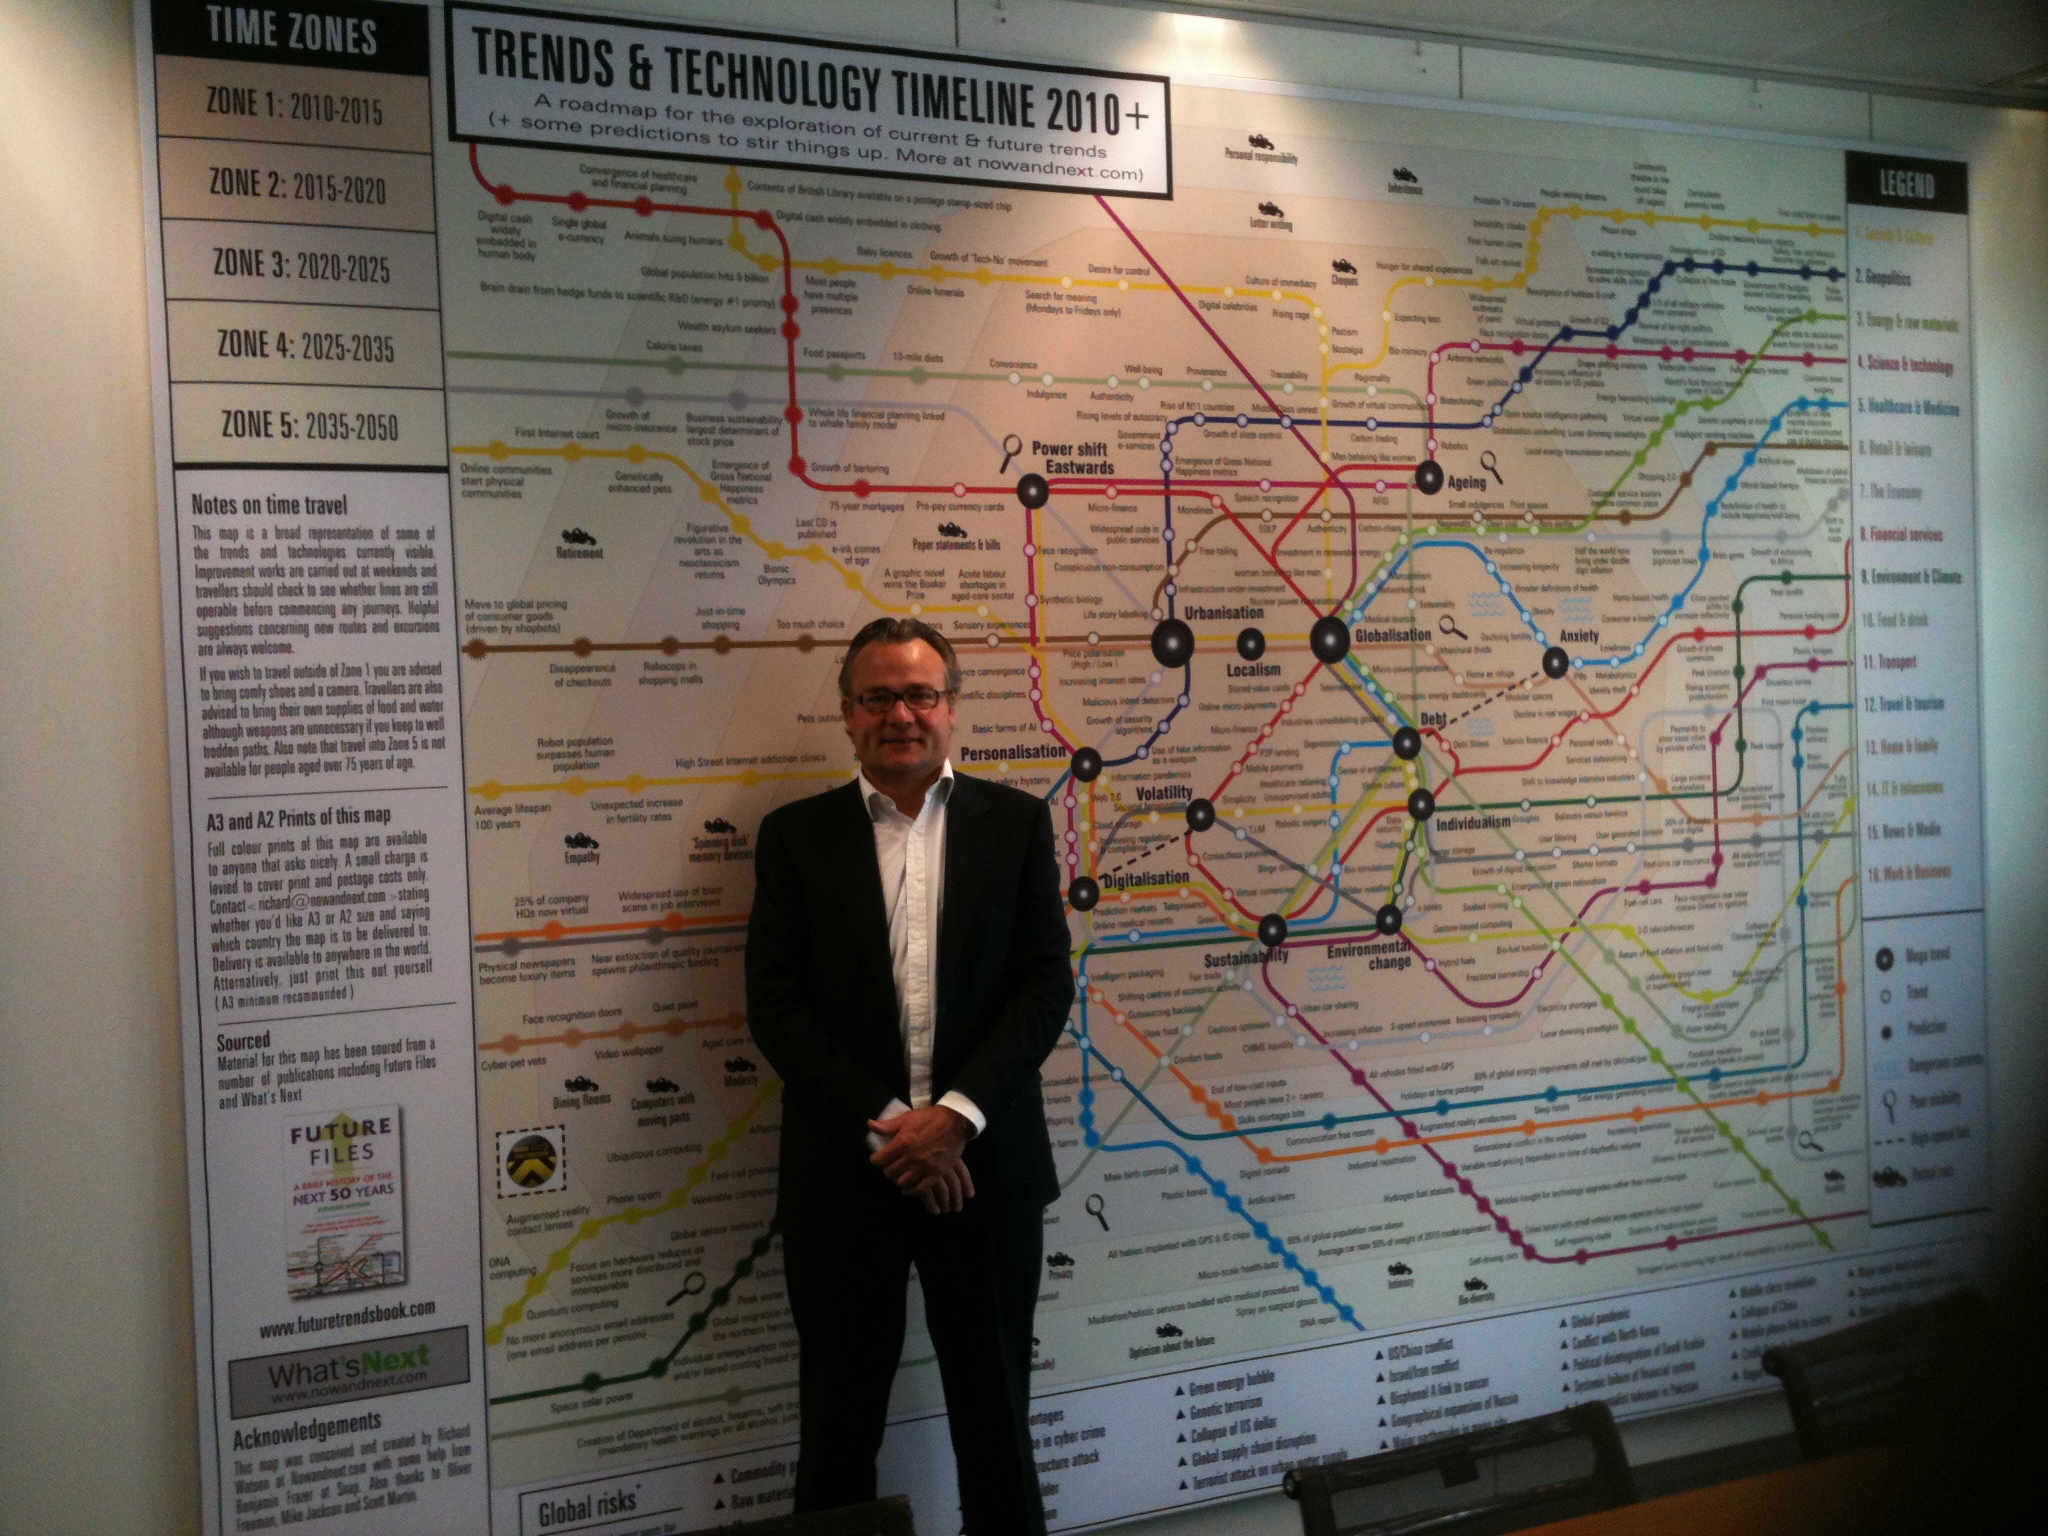
The main image, BTW, is me standing by my Trends and Technology Timeline 2010-2050. It was in a meeting room of a German company earlier this week. They told me in advance that they liked the map and had printed it and put it on a wall, but I wasn’t expecting anything quite so large!

Timeline of Future Events (From Speculative Fiction)


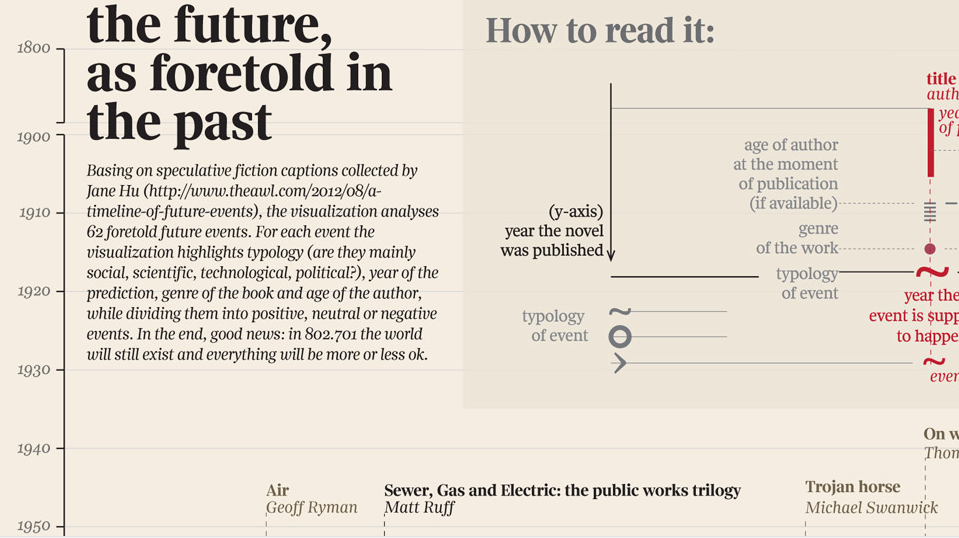
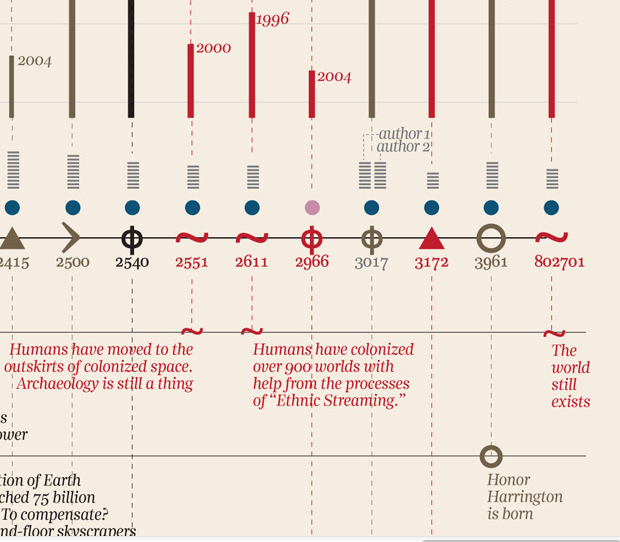
This is truly lovely. Gordon Gray has just sent me a link to a blog called Brain Pickings, which is, in their words: “a human-powered discovery engine for interestingness, culling and curating cross-disciplinary curiosity-quenchers, and separating the signal from the noise to bring you things you didn’t know you were interested in until you are.”

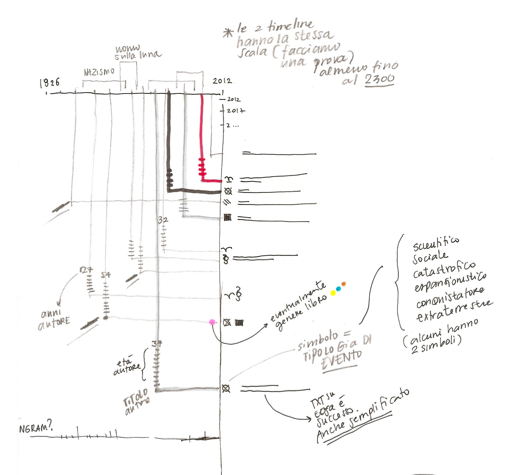
Anyway, an Italian designer called Giorgia Lupi recently created a visual timeline of future events, as predicted by famous novels, for an Italian newspaper called Corriere Della Sera. Brain pickings then asked her to do an English language version which she duly did. Click here for the link to the  whole timeline. I’ve attached some close-ups to show what bits of it look like and also an eraly rough drawing on the idea.

How it started…

Who (and Where) is Happy?


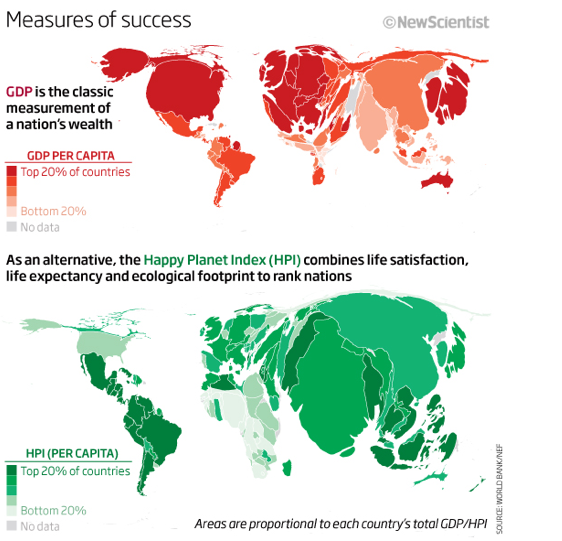
Going through a load of newspapers, magazines and websites today filtering material for the next issue of What’s Next and found this rather lovely graphic in New Scientist (16 June issue!). It shows measurement of economic success using GDP against something called the Happy Planet Index (HPI), which uses life satisfaction combined with life expectancy and ecological footprint. Personally, I’d add a few other measures such as general health, infant mortality, literacy rates, access to clean water, levels of corruption, unemployment, inflation and so on, but you have to start somewhere I suppose.

1970-2040 Timeline

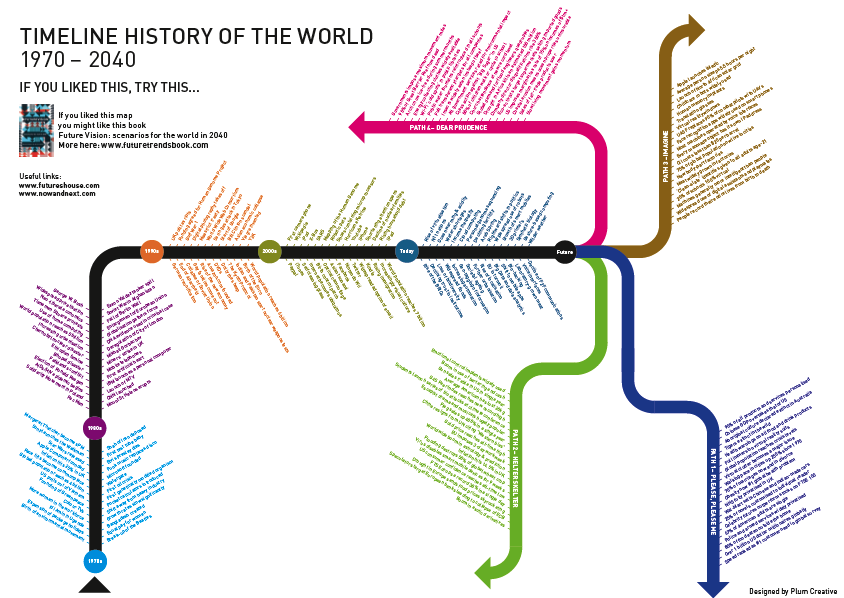
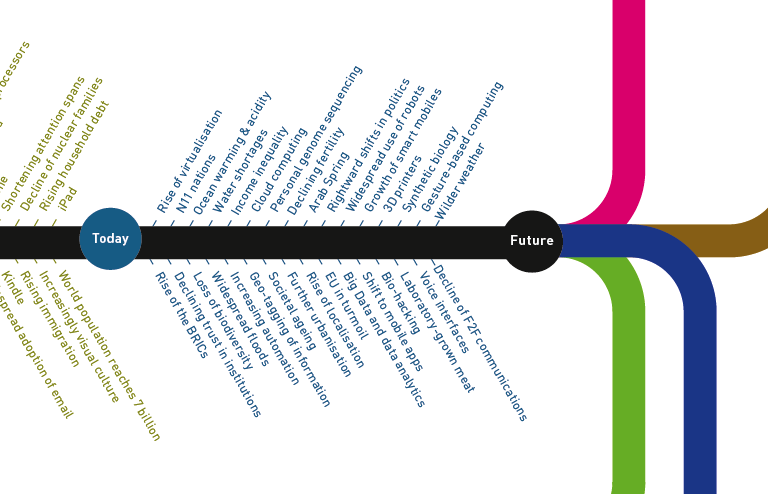
Yes, that’s right, a timeline for a period of history that hasn’t happened yet. This visualization is now done and I should have a URL for a high-resolution file version in a day or two (I’ll blog with the link as soon as it’s available).

The timeline is based in some of the thinking contained in my new book, FutureVision, and the point, I guess, is that the future forks. We think we are heading in one direction when suddenly reality changes direction. The events of 9 September 2001 might be a good example.

When available the high-resolution timeline will be best printed A3 colour.

How we die

So here I am at 7.10 pm (I know, get off the computer) wondering what the heck to say today when an email from Bradley pops up. Consider it stolen I say. Bottom line seems to be to relax, watch what you eat and walk around a bit (“eat, a bit, mostly plants”). Interesting the difference between what we think could kill us (strangers, terrorists, planes, sharks, savage foxes) and what actually does.

Oh, btw, it’s from the Guardian.