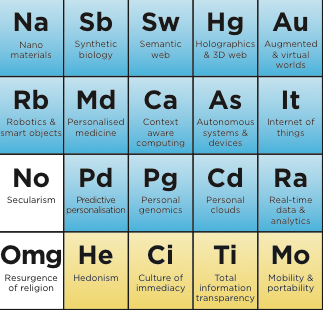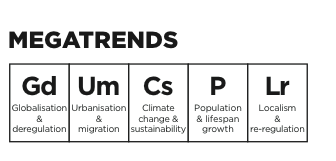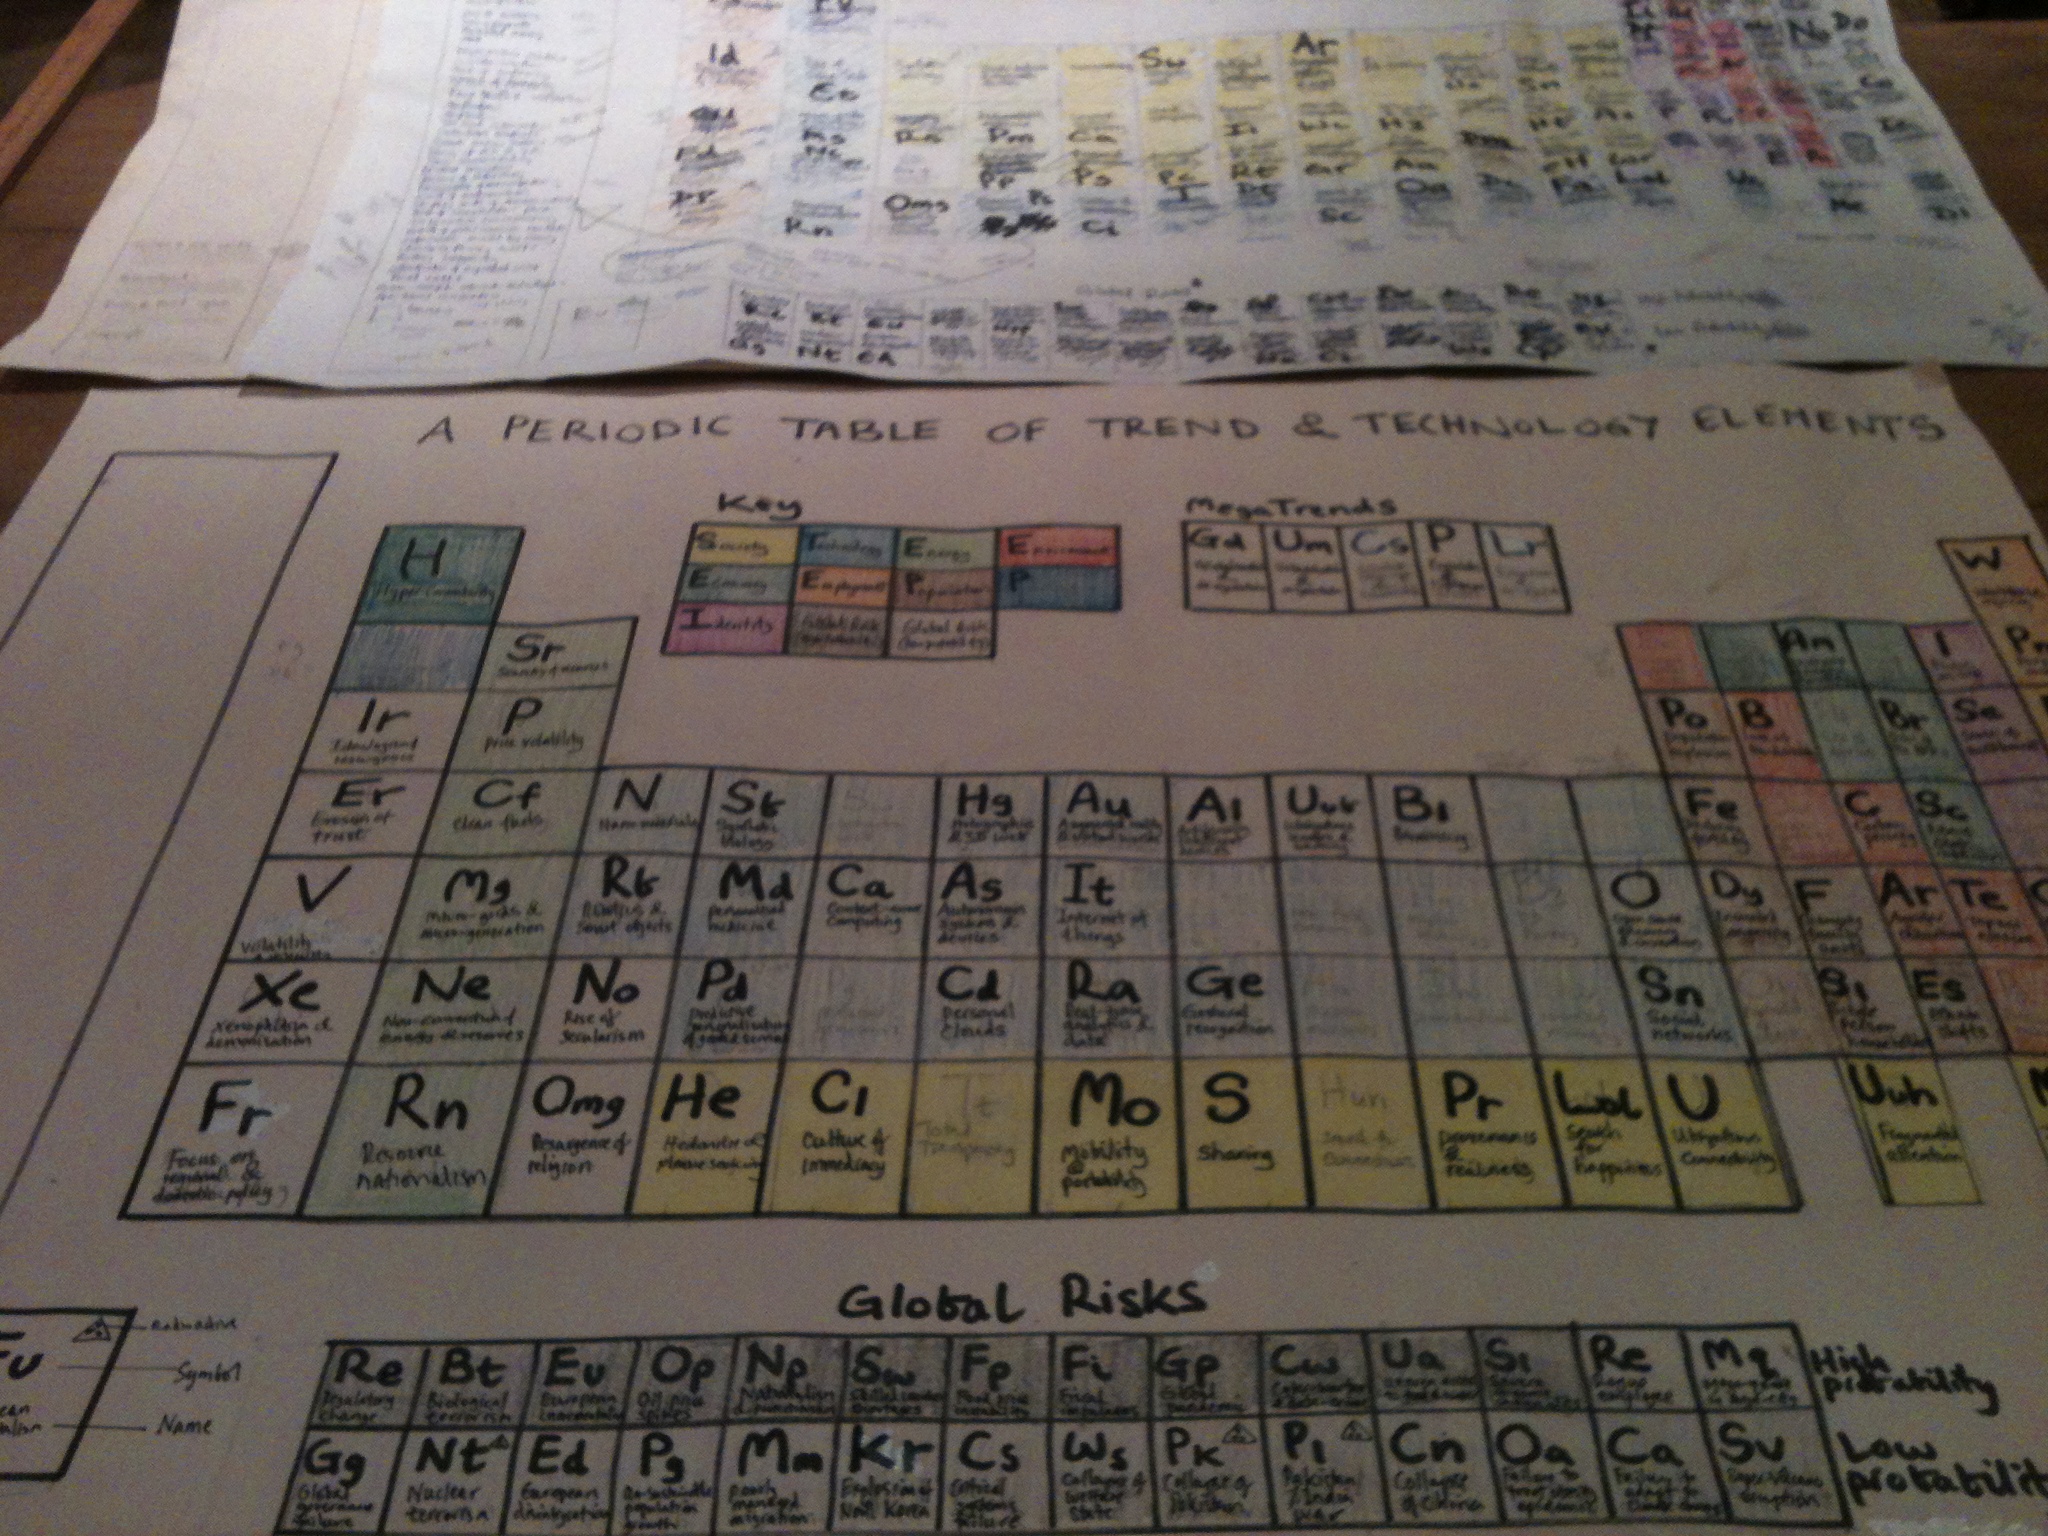
Here’s something to start a few arguments, which is the whole point of the exercise, of course. Briefly, it’s a table of key trends and technologies that are likely to shape the world out to 2020. I’ve used the periodic table, not because the trends are weighted in any way, but by following the basic structure of the table (i.e. the number of categories and boxes) this has forced me to edit what would otherwise be an almost endless list.
The categories themselves broadly follow S.T.E.E.P, which is widely used in scenario planning, but I’ve extended and added to this with the result that we have S.T.E.E.E.P.P.I (Society, Technology, Energy, Environment, Economy, Employment, Population, Politics and Identity). There are also two lines devoted to global risks, both high and low probability.
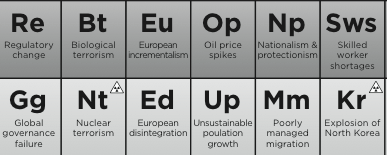
And, as usual, there are a few jokes so that people don’t take this too seriously. Lol, Omg. The link here is to a high resolution PDF suitable for printing. World .in 2020_
